Overview Dashboard
Your central hub for AI brand visibility insights.
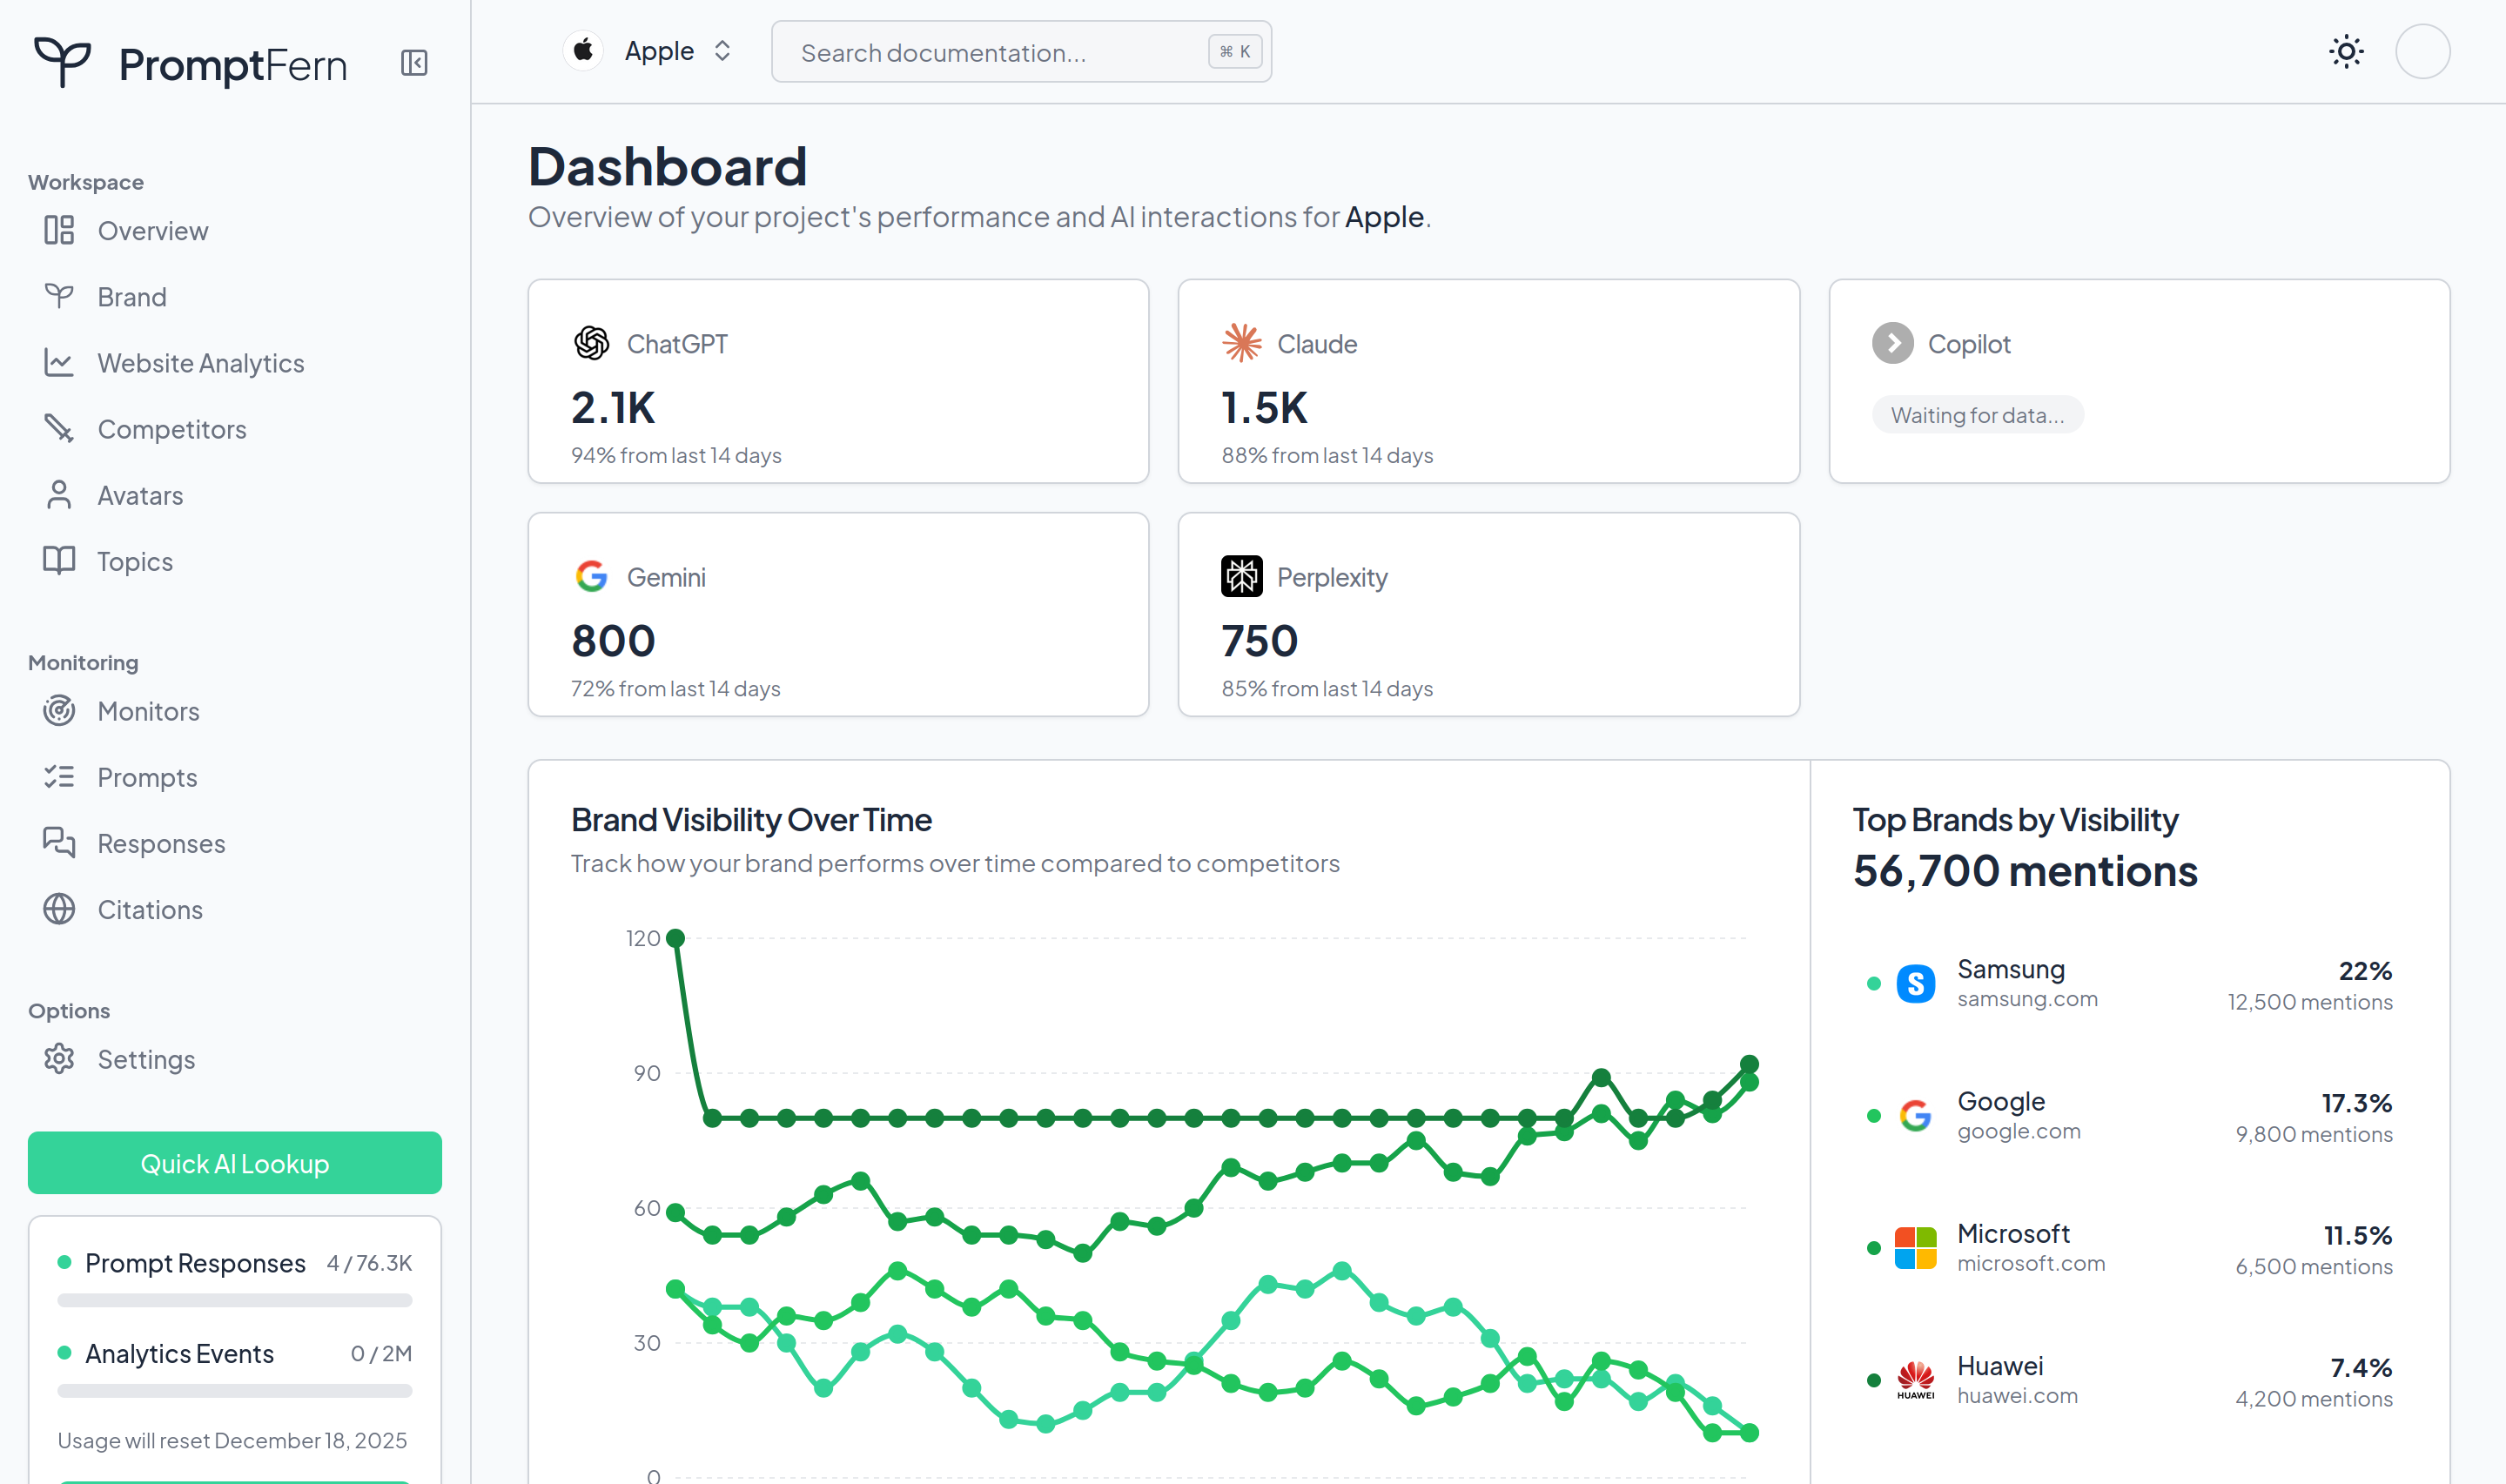
The Overview dashboard gives you a high-level view of your brand's AI visibility, competitive positioning, and key metrics.
Accessing the Overview
Click Overview in the sidebar to access your main dashboard.
Dashboard Sections
Visibility Score
A single metric representing your brand's overall visibility in AI responses. The score is calculated based on:
- Frequency of brand mentions
- Position in recommendations
- Positive vs negative sentiment
- Citation frequency
Score ranges:
| Score | Meaning |
|---|---|
| 80-100 | Excellent visibility |
| 60-79 | Good visibility |
| 40-59 | Moderate visibility |
| 20-39 | Low visibility |
| 0-19 | Minimal visibility |
Visibility Trend
A chart showing how your visibility score changes over time. Look for:
- Upward trends after content improvements
- Dips that correlate with competitor activity
- Seasonal patterns in your industry
Competitive Rankings
See how you rank against competitors in AI responses:
- Share of Voice: Percentage of mentions you get vs competitors
- Rank Position: Where you appear in recommendation lists
- Trend: Whether you're gaining or losing ground
Channel Performance
Compare visibility across different AI platforms:
- ChatGPT
- Claude
- Perplexity
- Gemini
- Google AI Overviews
Different channels may prioritize different sources, leading to varying visibility.
Top Citations
The most frequently cited sources in responses about your brand. Use this to:
- Identify influential publications
- Find content optimization opportunities
- Track your own content's reach
Monitor Activity
Summary of your active monitors:
- Total monitors running
- Responses collected this period
- Last run timestamps
- Next scheduled runs
Recent Responses
Quick preview of the latest AI responses mentioning your brand, with links to full response details.
Filtering the Dashboard
Date Range
Select the time period for all dashboard metrics:
- Last 7 days
- Last 30 days
- Last 90 days
- Custom range
Brand Selector
If you track multiple brands, switch between them using the brand dropdown.
Understanding Metrics
How visibility is calculated
Visibility scores combine several factors:
- Mention frequency: How often your brand appears in responses
- Position: Whether you're recommended first, mentioned in passing, or listed among many
- Context: Positive recommendations vs neutral mentions vs negative references
- Source quality: Responses from authoritative prompts weighted higher
What affects visibility
Your visibility in AI responses is influenced by:
- Online presence: Content, reviews, press coverage
- Authority signals: Links from trusted sources
- Recency: Fresh content gets indexed faster
- Query match: How well your content answers user questions
Improving your score
To improve visibility:
- Create content that directly answers common questions
- Get featured in authoritative publications
- Encourage customer reviews on platforms like G2
- Update existing content to stay current
- Monitor competitor strategies and differentiate
Using the Dashboard Effectively
Daily check-ins
Spend 2-3 minutes daily reviewing:
- Any significant visibility changes
- New responses worth reading
- Competitor movements
Weekly analysis
Once a week, go deeper:
- Review all responses from the past week
- Analyze citation patterns
- Identify content gaps
Monthly reporting
Use the dashboard for monthly stakeholder updates:
- Visibility trend over time
- Competitive positioning changes
- Key wins and opportunities
Dashboard vs Detailed Views
The Overview provides a summary. For deeper analysis, use:
- Monitors: Detailed prompt and response data
- Responses: Individual AI response analysis
- Citations: Source-level analysis
- Competitors: Competitive intelligence